
Work · Independent open-source work · AirSplatMap, MIT licensed
Real-Time Gaussian Splatting for Vehicles
A framework that streams RGB-D from a camera, drone or dataset and builds a 3D Gaussian-splat map as it goes, with a browser dashboard and an automated benchmark harness across five splatting engines.
The problem
Gaussian splatting research ships as one-off implementations, each tied to one engine, one pose front end and one dataset. That leaves the only question a vehicle integrator actually has unanswerable: which combination runs fast enough on hardware I can fly, and how much geometry do I lose when it does?
It is a question about the whole pipeline rather than any one stage. Pose estimation quality bounds map quality, depth estimation bounds pose, and the compute budget bounds all three — so comparing splatting engines in isolation tells you nothing you can act on.
What I did
The pipeline runs camera or drone, then pose estimation, then Gaussian splatting, then a web dashboard showing the map build in real time — with every stage pluggable, which is what makes the comparison possible at all.
Five splatting engines sit behind one interface: GSplat, GraphDeco, MonoGS, SplaTAM and Photo-SLAM. Visual odometry runs on ORB, SIFT, LoFTR, SuperPoint or RealSense VIO, and monocular depth on MiDaS, Depth Anything V2 and V3, or Depth Pro. ArduPilot MAVLink integration connects it to real drones and rovers rather than only to datasets.
Deployment covers the hardware that matters here: Ubuntu and Windows with RTX-class GPUs, and NVIDIA Jetson Orin — Nano, NX and AGX on JetPack 6 — with the platform auto-detected and NVIDIA's SM 8.7 PyTorch wheels used so all five engines run on the Jetson, not just the cheap ones.
Result
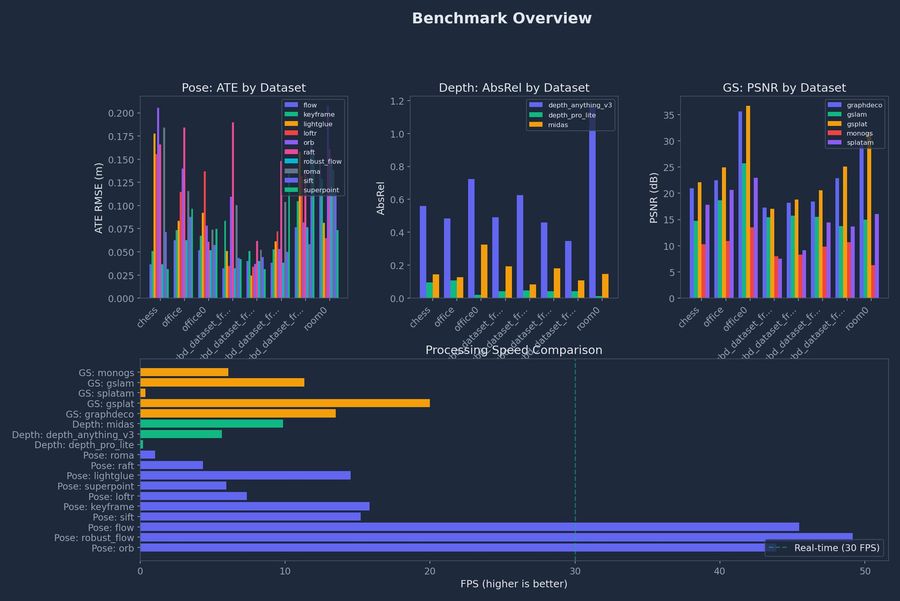
An automated benchmark harness runs the matrix and produces the comparison plots directly: per-scene rendering efficiency and quality, pose accuracy across the visual-odometry front ends, depth estimator comparisons, and combined overview and radar plots that put the engines side by side.
That harness is the point. It turns which stack should fly from an argument into a measurement, and it is the working implementation of the evaluation design I proposed in the Gaussian splatting survey — the same metrics, on real hardware, with the numbers falling out as plots.
From the report
Bench photographs and measured data from the project's own report.